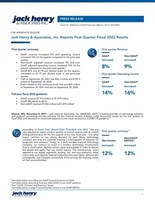
First quarter summary:
- GAAP revenue increased 8% and operating income increased 14% for the quarter compared to the prior-year quarter.
- Non-GAAP adjusted revenue increased 9% and non-GAAP adjusted operating income increased 16% for the quarter compared to the prior-year quarter.1
- GAAP EPS was
$1.38 per diluted share for the quarter, compared to$1.19 per diluted share in the prior-year quarter. - Cash at
September 30, 2021 was$44.3 million and$195.3 million atSeptember 30, 2020 . - Debt related to the revolving credit line was
$65 million atSeptember 30, 2021 and zero atSeptember 30, 2020 .
Full-year fiscal 2022 guidance:
- GAAP revenue
$1,910 million to$1,919 million - GAAP EPS
$4.64 to$4.73 - Non-GAAP revenue
$1,866 million to$1,875 million 2

According to
|
1 See tables below reconciling non-GAAP financial measures to GAAP. |
|
2 See tables below reconciling fiscal year 2022 GAAP to non-GAAP guidance. |
|
3 See "COVID-19 Impact and Response" below. |
|
4 See tables below on page 9 reconciling Net Income to non-GAAP EBITDA. |
Operating Results
Revenue, operating expenses, operating income, and net income for the three months ended
|
(Unaudited, in thousands) |
Three Months Ended |
% Change |
||||||||
|
2021 |
2020 |
|||||||||
|
Services and support |
$ |
297,494 |
$ |
280,997 |
6 |
% |
||||
|
Percentage of total revenue |
61 |
% |
62 |
% |
||||||
|
Processing |
190,562 |
170,803 |
12 |
% |
||||||
|
Percentage of total revenue |
39 |
% |
38 |
% |
||||||
|
REVENUE |
$ |
488,056 |
$ |
451,800 |
8 |
% |
||||
- Processing revenue increased for the first quarter primarily driven by growth in card processing of 9%. Other increases were in remittance revenues and Jack Henry digital. Services and support revenue increased for the first quarter primarily driven by growth in data processing and hosting fees of 12% and increased software usage fees.
- For the first quarter, core segment revenue increased 8%, payments segment revenue increased 8%, complementary segment revenue increased 9%, and corporate and other segment revenue increased 1%. Non-GAAP core segment revenue increased 9%, payments segment revenue increased 9%, complementary segment revenue increased 9%, and corporate and other segment revenue increased 1%.5
|
(Unaudited, in thousands) |
Three Months Ended |
% Change |
||||||||
|
2021 |
2020 |
|||||||||
|
Cost of revenue |
$ |
276,636 |
$ |
262,929 |
5 |
% |
||||
|
Percentage of total revenue |
57 |
% |
58 |
% |
||||||
|
Research and development |
26,754 |
26,057 |
3 |
% |
||||||
|
Percentage of total revenue |
5 |
% |
6 |
% |
||||||
|
Selling, general, and administrative |
51,071 |
45,226 |
13 |
% |
||||||
|
Percentage of total revenue |
10 |
% |
10 |
% |
||||||
|
OPERATING EXPENSES |
354,461 |
334,212 |
6 |
% |
||||||
|
OPERATING INCOME |
$ |
133,595 |
$ |
117,588 |
14 |
% |
||||
|
Operating margin6 |
27 |
% |
26 |
% |
||||||
- Cost of revenue increased for the first quarter primarily due to higher costs associated with our card processing platform, operating licenses and fees, and personnel costs, partially offset by decreased hardware costs.
- Research and development expense increased for the first quarter primarily due to higher professional fees, personnel costs, contract labor, and licenses and fees, partially offset by higher capitalized research and development costs.
- Selling, general, and administrative expense increased for the first quarter primarily due to higher personnel costs and travel expenses as COVID-related travel limitations began to lift.7
|
5 See revenue lines of segment break-out tables on page 4 below. |
|
6 Operating margin is calculated by dividing operating income by revenue. |
|
7 See "COVID-19 Impact and Response" below. |
|
(Unaudited, in thousands, except shares and per share data) |
Three Months Ended |
% Change |
||||||||
|
2021 |
2020 |
|||||||||
|
Income before income taxes |
$ |
133,354 |
$ |
117,539 |
13 |
% |
||||
|
Provision for income taxes |
31,240 |
26,323 |
19 |
% |
||||||
|
NET INCOME |
$ |
102,114 |
$ |
91,216 |
12 |
% |
||||
|
Diluted earnings per share |
$ |
1.38 |
$ |
1.19 |
16 |
% |
||||
- Effective tax rates for the first quarter of fiscal years 2022 and 2021 were 23.4% and 22.4%, respectively.
- The Company's repurchase of 2.8 million shares of common stock during fiscal year 2021 contributed
$0.05 to diluted earnings per share for the first quarter of fiscal year 2022.
According to
Non-GAAP Impact of Deconversion Fees, Acquisitions and Divestitures
The table below is our revenue and operating income (in thousands) for the three months ended
|
Three Months Ended |
% Change |
|||||||||
|
(Unaudited, in thousands) |
2021 |
2020 |
||||||||
|
Revenue (GAAP) |
$ |
488,056 |
$ |
451,800 |
8 |
% |
||||
|
Adjustments: |
||||||||||
|
Deconversion fee revenue |
(3,724) |
(5,882) |
||||||||
|
Revenue from acquisitions and divestitures |
(106) |
(1,182) |
||||||||
|
NON-GAAP ADJUSTED REVENUE |
$ |
484,226 |
$ |
444,736 |
9 |
% |
||||
|
Operating income (GAAP) |
$ |
133,595 |
$ |
117,588 |
14 |
% |
||||
|
Adjustments: |
||||||||||
|
Operating income from deconversion fees |
(3,184) |
(5,219) |
||||||||
|
Operating (income)/loss from acquisitions and divestitures |
45 |
(369) |
||||||||
|
NON-GAAP ADJUSTED OPERATING INCOME |
$ |
130,456 |
$ |
112,000 |
16 |
% |
||||
The tables below are the segment breakdown of revenue and cost of revenue for each period presented, as adjusted for the items above, and include a reconciliation to non-GAAP adjusted operating income presented above.
|
Three Months Ended |
|||||||||||||||||||
|
(Unaudited, in thousands) |
Core |
Payments |
Complementary |
Corporate |
Total |
||||||||||||||
|
REVENUE (GAAP) |
$ |
165,285 |
$ |
169,622 |
$ |
141,481 |
$ |
11,668 |
$ |
488,056 |
|||||||||
|
Deconversion fees |
(2,168) |
(448) |
(1,097) |
(11) |
(3,724) |
||||||||||||||
|
Revenue from acquisitions and divestitures |
— |
— |
(106) |
— |
(106) |
||||||||||||||
|
NON-GAAP ADJUSTED REVENUE |
163,117 |
169,174 |
140,278 |
11,657 |
484,226 |
||||||||||||||
|
COST OF REVENUE |
66,902 |
93,226 |
55,485 |
61,023 |
276,636 |
||||||||||||||
|
Non-GAAP adjustments |
(138) |
(45) |
(242) |
(1) |
(426) |
||||||||||||||
|
NON-GAAP ADJUSTED COST OF REVENUE |
66,764 |
93,181 |
55,243 |
61,022 |
276,210 |
||||||||||||||
|
NON-GAAP ADJUSTED SEGMENT INCOME |
$ |
96,353 |
$ |
75,993 |
$ |
85,035 |
$ |
(49,365) |
|||||||||||
|
Research and development |
26,754 |
||||||||||||||||||
|
Selling, general, and administrative |
51,071 |
||||||||||||||||||
|
Non-GAAP adjustments unassigned to a segment |
(265) |
||||||||||||||||||
|
NON-GAAP TOTAL ADJUSTED OPERATING EXPENSES |
353,770 |
||||||||||||||||||
|
NON-GAAP ADJUSTED OPERATING INCOME |
$ |
130,456 |
|||||||||||||||||
|
Three Months Ended |
|||||||||||||||||||
|
(Unaudited, in thousands) |
Core |
Payments |
Complementary |
Corporate |
Total |
||||||||||||||
|
REVENUE (GAAP) |
$ |
153,155 |
$ |
156,733 |
$ |
130,355 |
$ |
11,557 |
$ |
451,800 |
|||||||||
|
Deconversion fees |
(2,052) |
(1,847) |
(2,000) |
17 |
(5,882) |
||||||||||||||
|
Revenue from acquisitions and divestitures |
(1,182) |
— |
— |
— |
(1,182) |
||||||||||||||
|
NON-GAAP ADJUSTED REVENUE |
149,921 |
154,886 |
128,355 |
11,574 |
444,736 |
||||||||||||||
|
COST OF REVENUE |
63,861 |
86,328 |
52,024 |
60,716 |
262,929 |
||||||||||||||
|
Non-GAAP adjustments |
(794) |
(60) |
(180) |
(39) |
(1,073) |
||||||||||||||
|
NON-GAAP ADJUSTED COST OF REVENUE |
63,067 |
86,268 |
51,844 |
60,677 |
261,856 |
||||||||||||||
|
NON-GAAP ADJUSTED SEGMENT INCOME |
$ |
86,854 |
$ |
68,618 |
$ |
76,511 |
$ |
(49,103) |
|||||||||||
|
Research and development |
26,057 |
||||||||||||||||||
|
Selling, general, and administrative |
45,226 |
||||||||||||||||||
|
Non-GAAP adjustments unassigned to a segment |
(403) |
||||||||||||||||||
|
NON-GAAP TOTAL ADJUSTED OPERATING EXPENSES |
332,736 |
||||||||||||||||||
|
NON-GAAP ADJUSTED OPERATING INCOME |
$ |
112,000 |
|||||||||||||||||
The table below is our GAAP to non-GAAP guidance for fiscal 2022. Non-GAAP guidance excludes the impacts of deconversion fee, acquisition and divestiture revenue.
|
GAAP to Non-GAAP GUIDANCE (in millions, except per share data) |
Annual FY22 |
|||||||
|
Low |
High |
|||||||
|
REVENUE (GAAP) |
$ |
1,910 |
$ |
1,919 |
||||
|
Growth |
8.6 |
% |
9.1 |
% |
||||
|
Deconversion fee, acquisition and divestiture revenue |
44 |
44 |
||||||
|
NON-GAAP ADJUSTED REVENUE |
$ |
1,866 |
$ |
1,875 |
||||
|
Non-GAAP adjusted growth* |
7.5 |
% |
8.0 |
% |
||||
|
EPS (GAAP) |
$ |
4.64 |
$ |
4.73 |
||||
|
Growth |
12.8 |
% |
14.8 |
% |
||||
Balance Sheet and Cash Flow Review
 to GAAP measures are also on page 10. See \"Use of Non-GAAP Financial Information\" below for definition of Free Cash Flow and ROIC.")
- At
September 30, 2021 , cash and cash equivalents decreased to$44.3 million from$195.3 million atSeptember 30, 2020 .** - Trade receivables totaled
$253.2 million atSeptember 30, 2021 compared to$223.0 million atSeptember 30, 2020 . - The Company had
$65 million of borrowings atSeptember 30, 2021 and no borrowings atSeptember 30, 2020 .** - Total deferred revenue increased to
$334.9 million atSeptember 30, 2021 , compared to$322.5 million a year ago. - Stockholders' equity decreased to
$1,395.7 million atSeptember 30, 2021 , compared to$1,543.8 million a year ago.**
|
* See tables below on page 6 for Net Cash Provided by Operating Activities and on page 10 for Return on Average Shareholders' Equity. Tables reconciling the non-GAAP measures Free Cash Flow and return on invested capital (ROIC) to GAAP measures are also on page 10. See "Use of Non-GAAP Financial Information" below for definition of Free Cash Flow and ROIC. |
|
** The changes in cash and cash equivalents, borrowings and stockholders' equity, quarter over quarter, were primarily due to the Company's repurchases of common stock during fiscal 2021 for the treasury. |
The following table summarizes net cash from operating activities (Unaudited, in thousands):
|
Three Months Ended |
|||||||
|
2021 |
2020 |
||||||
|
Net income |
$ |
102,114 |
$ |
91,216 |
|||
|
Depreciation |
13,157 |
13,391 |
|||||
|
Amortization |
31,016 |
30,352 |
|||||
|
Change in deferred income taxes |
6,088 |
2,393 |
|||||
|
Other non-cash expenses |
6,237 |
4,466 |
|||||
|
Change in receivables |
53,404 |
77,439 |
|||||
|
Change in deferred revenue |
(60,662) |
(67,113) |
|||||
|
Change in other assets and liabilities |
(44,805) |
(37,667) |
|||||
|
NET CASH PROVIDED BY OPERATING ACTIVITIES |
$ |
106,549 |
$ |
114,477 |
|||
The following table summarizes net cash from investing activities (Unaudited, in thousands):
|
Three Months Ended |
|||||||
|
2021 |
2020 |
||||||
|
Capital expenditures |
$ |
(9,273) |
$ |
(4,478) |
|||
|
Proceeds from dispositions |
14 |
6,115 |
|||||
|
Purchased software |
(1,221) |
(1,374) |
|||||
|
Computer software developed |
(35,971) |
(31,451) |
|||||
|
NET CASH FROM INVESTING ACTIVITIES |
$ |
(46,451) |
$ |
(31,188) |
|||
The following table summarizes net cash from financing activities (Unaudited, in thousands):
|
Three Months Ended |
|||||||
|
2021 |
2020 |
||||||
|
Repayments on credit facilities and financing leases |
$ |
(35,027) |
$ |
(28) |
|||
|
Purchase of treasury stock* |
— |
(65,873) |
|||||
|
Dividends paid |
(34,036) |
(32,815) |
|||||
|
Net cash from issuance of stock and tax related to stock-based compensation |
2,224 |
(2,598) |
|||||
|
NET CASH FROM FINANCING ACTIVITIES |
$ |
(66,839) |
$ |
(101,314) |
|||
|
* For the three months ended |
Use of Non-GAAP Financial Information
Generally Accepted Accounting Principles (GAAP) is the term used to refer to the standard framework of guidelines for financial accounting in
We believe non-GAAP financial measures help investors better understand the underlying fundamentals and true operations of our business. The non-GAAP financial measures adjusted revenue, adjusted operating income, adjusted segment income, adjusted cost of revenue, and adjusted operating expenses presented eliminate one-time deconversion fees, acquisitions and divestitures, all of which management believes are not indicative of the Company's operating performance. Such adjustments give investors further insight into our performance. Non-GAAP EBITDA is defined as net income attributable to the Company before the effect of interest expense, taxes, depreciation, and amortization, adjusted for net income before the effect of interest expense, taxes, depreciation, and amortization attributable to eliminated one-time deconversion fees, acquisitions and divestitures. Free cash flow is defined as net cash from operating activities, less capitalized expenditures, internal use software, and capitalized software, plus proceeds from the sale of assets. ROIC is defined as net income divided by average invested capital, which is the average of beginning and ending long-term debt and stockholders' equity for a given period. Management believes that non-GAAP EBITDA is an important measure of the Company's overall operating performance and excludes certain costs and other transactions that management deems one time or non-operational in nature; free cash flow is useful to measure the funds generated in a given period that are available for debt service requirements and strategic capital decisions; and ROIC is a measure of the Company's allocation efficiency and effectiveness of its invested capital. For these reasons, management also uses these non-GAAP financial measures in its assessment and management of the Company's performance.
Non-GAAP measures used by the Company may not be comparable to similarly titled non-GAAP measures used by other companies. Non-GAAP financial measures have no standardized meaning prescribed by GAAP and therefore, are unlikely to be comparable with calculations of similar measures for other companies.
Any non-GAAP financial measures should be considered in context with the GAAP financial presentation and should not be considered in isolation or as a substitute for GAAP measures. Reconciliations of the non-GAAP financial measures to related GAAP measures are included.
COVID-19 Impact and Response
Since its outbreak in early 2020, COVID-19 has rapidly spread and continues to represent a public health concern. The health, safety, and well-being of our employees and customers is of paramount importance to us. In
Customers
We work closely with our customers who are scheduled for on-site visits to ensure their needs are met while taking necessary safety precautions when our employees are required to be at a customer site. Delays of customer system installations due to COVID-19 have been limited, and we have developed processes to handle remote installations when available. We expect these processes to provide flexibility and value both during and after the COVID-19 pandemic. Even though a substantial portion of our workforce has worked remotely during the outbreak and business travel has been curtailed, we have not yet experienced significant disruption to our operations. We believe our technological capabilities are well positioned to allow our employees to work remotely without materially impacting our business.
Financial impact
Despite the changes and restrictions caused by COVID-19, the overall financial and operational impact on our business has been limited and our liquidity, balance sheet, and business trends remain strong. We experienced positive operating cash flows during fiscal 2021 and the first three months of fiscal 2022, and we do not expect that to change in the near term. However, we are unable to accurately predict the future impact of COVID-19 due to a number of uncertainties, including further government actions; the duration, severity and recurrence of the outbreak, including the onset of variants of the virus; the speed and effectiveness of vaccine and treatment developments; the speed of economic recovery; the potential impact to our customers, vendors, and employees; and how the potential impact might affect future customer services, processing and installation-related revenue, and processes and efficiencies within the Company directly or indirectly impacting financial results. We will continue to monitor COVID-19 and its possible impact on the Company and to take steps necessary to protect the health and safety of our employees and customers.
Quarterly Conference Call
The Company will hold a conference call on
For More Information
To directly access the Company's press releases, go to ir.jackhenry.com/press-releases.
About
Statements made in this news release that are not historical facts are "forward-looking statements" within the meaning of the Private Securities Litigation Reform Act of 1995, Section 27A of the Securities Act of 1933 and Section 21E of the Securities Exchange Act of 1934. Because forward-looking statements relate to the future, they are subject to inherent risks and uncertainties that could cause actual results to differ materially from those expressed or implied by such statements. Such risks and uncertainties include, but are not limited to, those discussed in the Company's
|
Condensed Consolidated Statements of Income |
% Change |
|||||||||
|
Three Months Ended |
||||||||||
|
(Unaudited, in thousands, except per share data) |
2021 |
2020 |
||||||||
|
REVENUE |
$ |
488,056 |
$ |
451,800 |
8 |
% |
||||
|
Cost of revenue |
276,636 |
262,929 |
5 |
% |
||||||
|
Research and development |
26,754 |
26,057 |
3 |
% |
||||||
|
Selling, general, and administrative |
51,071 |
45,226 |
13 |
% |
||||||
|
EXPENSES |
354,461 |
334,212 |
6 |
% |
||||||
|
OPERATING INCOME |
133,595 |
117,588 |
14 |
% |
||||||
|
Interest income |
7 |
68 |
(90) |
% |
||||||
|
Interest expense |
(248) |
(117) |
112 |
% |
||||||
|
Interest income (expense) |
(241) |
(49) |
392 |
% |
||||||
|
INCOME BEFORE INCOME TAXES |
133,354 |
117,539 |
13 |
% |
||||||
|
Provision for income taxes |
31,240 |
26,323 |
19 |
% |
||||||
|
NET INCOME |
$ |
102,114 |
$ |
91,216 |
12 |
% |
||||
|
Diluted net income per share |
$ |
1.38 |
$ |
1.19 |
||||||
|
Diluted weighted average shares outstanding |
74,142 |
76,713 |
||||||||
|
Condensed Consolidated Balance Sheet Highlights |
||||||||||
|
|
||||||||||
|
(Unaudited, in thousands) |
2021 |
2020 |
||||||||
|
Cash and cash equivalents |
$ |
44,251 |
$ |
195,320 |
||||||
|
Receivables |
253,160 |
223,013 |
||||||||
|
Total assets |
2,280,911 |
2,335,076 |
||||||||
|
Accounts payable and accrued expenses |
$ |
161,088 |
$ |
151,609 |
||||||
|
Current and long-term debt |
65,166 |
295 |
||||||||
|
Deferred revenue |
334,939 |
322,509 |
||||||||
|
Stockholders' equity |
1,395,665 |
1,543,750 |
||||||||
|
Calculation of Non-GAAP Earnings Before Income Taxes, Depreciation and Amortization (Non-GAAP EBITDA) |
% Change |
|||||||||
|
Three Months Ended |
||||||||||
|
(in thousands) |
2021 |
2020 |
||||||||
|
Net income |
$ |
102,114 |
$ |
91,216 |
||||||
|
Interest expense |
248 |
118 |
||||||||
|
Taxes |
31,240 |
26,323 |
||||||||
|
Depreciation and amortization |
44,173 |
43,743 |
||||||||
|
Less: Net income before interest expense, taxes, depreciation and amortization attributable to eliminated one-time deconversions, acquisitions and divestitures |
(3,157) |
(5,946) |
||||||||
|
NON-GAAP EBITDA |
$ |
174,618 |
$ |
155,454 |
12 |
% |
||||
|
Calculation of Free Cash Flow (Non-GAAP) |
||||||||||
|
Three Months Ended |
||||||||||
|
(in thousands) |
2021 |
2020 |
||||||||
|
Net cash from operating activities |
$ |
106,549 |
$ |
114,477 |
||||||
|
Capitalized expenditures |
(9,273) |
(4,478) |
||||||||
|
Internal use software |
(1,221) |
(1,374) |
||||||||
|
Proceeds from sale of assets |
14 |
6,115 |
||||||||
|
Capitalized software |
(35,971) |
(31,451) |
||||||||
|
FREE CASH FLOW |
$ |
60,098 |
$ |
83,289 |
||||||
|
Calculation of the Return on Average Shareholders' Equity |
||||||||||
|
|
||||||||||
|
(in thousands) |
2021 |
2020 |
||||||||
|
Net income (trailing four quarters) |
$ |
322,366 |
$ |
298,514 |
||||||
|
Average stockholder's equity (trailing four quarters) |
1,469,708 |
1,510,205 |
||||||||
|
RETURN ON AVERAGE SHAREHOLDERS' EQUITY |
21.9 |
% |
19.8 |
% |
||||||
|
Calculation of Return on |
||||||||||
|
|
||||||||||
|
(in thousands) |
2021 |
2020 |
||||||||
|
Net income (trailing four quarters) |
$ |
322,366 |
$ |
298,514 |
||||||
|
Average stockholder's equity (trailing four quarters) |
1,469,708 |
1,510,205 |
||||||||
|
Average current maturities of long-term debt (trailing four quarters) |
118 |
63 |
||||||||
|
Average long-term debt (trailing four quarters) |
32,613 |
85 |
||||||||
|
Average invested capital |
$ |
1,502,439 |
$ |
1,510,353 |
||||||
|
ROIC |
21.5 |
% |
19.8 |
% |
||||||
![]()
![]() View original content to download multimedia:https://www.prnewswire.com/news-releases/jack-henry--associates-inc-reports-first-quarter-fiscal-2022-results-301418982.html
View original content to download multimedia:https://www.prnewswire.com/news-releases/jack-henry--associates-inc-reports-first-quarter-fiscal-2022-results-301418982.html
SOURCE
MEDIA, Heather Sugg, APR, Senior Vice President, William Mills & Associates, 954-854-6203, Heather@williammills.com or ANALYSTS, Vance Sherard, CFA, Investor Relations, Jack Henry & Associates, Inc., 417-235-6652, VSherard@jackhenry.com